Open source software helps students and researchers solve unique problems and construct purpose-built solutions.
A picture is worth at least thousand words
Throughout the course of my masters research in subduction zone geodynamics at URI-GSO I was faced with challenges that all stemmed from one seemingly unrelated field of study: digital image processing. It turns out that many scientists and seemingly disparate fields rely on the same basic image processing principals to do their work. Photography is perhaps the original form of remote sensing. Modern satellite-based systems, aerial land surveys, time-lapse imagery of fluid dynamic experiments all utilize what boil down to bascially the same methods.
The general outline of my problem seemed pretty simple to me: tracking colored fluid blobs in 3D space and time within another working fluid using 2 DSLR cameras. Initially I assumed there would be an existing package or project that suited my needs, but I have yet to find it (please let me know of any other similar projects, I’m always interested to see how others do it). I was sure I would be writing or using software to automate much of the process as I had hundreds of gigabytes of raw experimental data to comb through and analyze, with each of my ~50 experiments usually consisting of hundreds of 4K/UHD frames from at least two cameras/angles.
Previous students had used manual or semi-manual approaches like GraphClick or Tracker that were pretty good but didn’t exactly suit my needs and were a little cumbersome. That said, these are both great ways to digitize data in 2D. I was also advised to check out Streams and PIVLab which were much closer to what I wanted but still did not facilitate registration of features between the two cameras. At this point I also had no clue about registration, features and their detection, calibration (yikes!), contrast and histogram equalization, color spaces, or basically any of the requisite knowledge I would need to solve this problem. I also knew of and had access to MATLAB and the image processing toolbox, but have always preferred open-source methods when possible, and Python is my favorite language.
In my first year I attended a workshop on analogue modeling that addressed many of the data collection and processing concerns I was having, and took a class in imaging and mapping that gave me an introduction and scaffolding of topics I would need to learn.
What I came up with after a lot of research and development was a set of scripts that accomplished each of the individual tasks in my pipeline that were controlled from a single driver script and could be run in batch on all of my data. Programming WIN!!! It did take me a few months to get this whole thing working, during which I probably could have processed my data by hand, but that would have been way lamer and I wouldn’t have learned nearly as much.
Here is the breakdown of the processing pipeline:
The entire pipeline is non-destructive, meaning at each step we save copies to prevent corrupting original data and allowing us to pick it up mid-pipeline if necessary. Also, for embarrasingly parralel tasks these scripts will run in a multi-threaded manner. The files are heavily commented and should be relatively self-explanatory.
The scripts rely on a directory structure like that depicted below with a directory named “original” containing the raw experimental images (currently expects JPEGS but should work with whatever format with little modification) and then create the rest of the folders and files:
EXP_DIR # top level experiment folder
  - original # folder containing set of original images
  - undistorted # folder where undistorted images will be dumped
  - cropped # folder where cropped images live
  - masked # folder where masked images are saved
  - crop-corners.txt # file with saved crop corner coordinates
  - saves-thresholds.txt # file with saved mask properties
  - alltracks.csv # file containing all tracked particle trajectories
  - goodtracks.csv # file containing filterd particle trajectories
  - EXP_DIR-tracks.png # image with alltracks and goodtracks plotted
  - EXP_DIR-HSV-hist.png # HSV channel histograms for tuning mask values
- Step #1 - Remove lens distortion. This functionality is implemented in
batchLensCorrector.py
and
myUndistort.py
. These scripts to remove intrinsic lens distortion from camera images using the Lensfun database and EXIF data in batch. Borrowed and modified from Python Lens Correction. Distortion scripts depend on:
- lensfunpy
- cv2 (I used 3.1.0 and can’t confirm these will work with any other version)
- os
- multiprocessing
- exiftool
- timeit

Image with lens distortion removed. - Step #2 - Crop original frame to a sensible ROI (region of interest) using
clickAndCrop.py
and
batchCrop.py
. These depend on:
- argparse
- cv2
- json
- os
- time
- multiprocessing
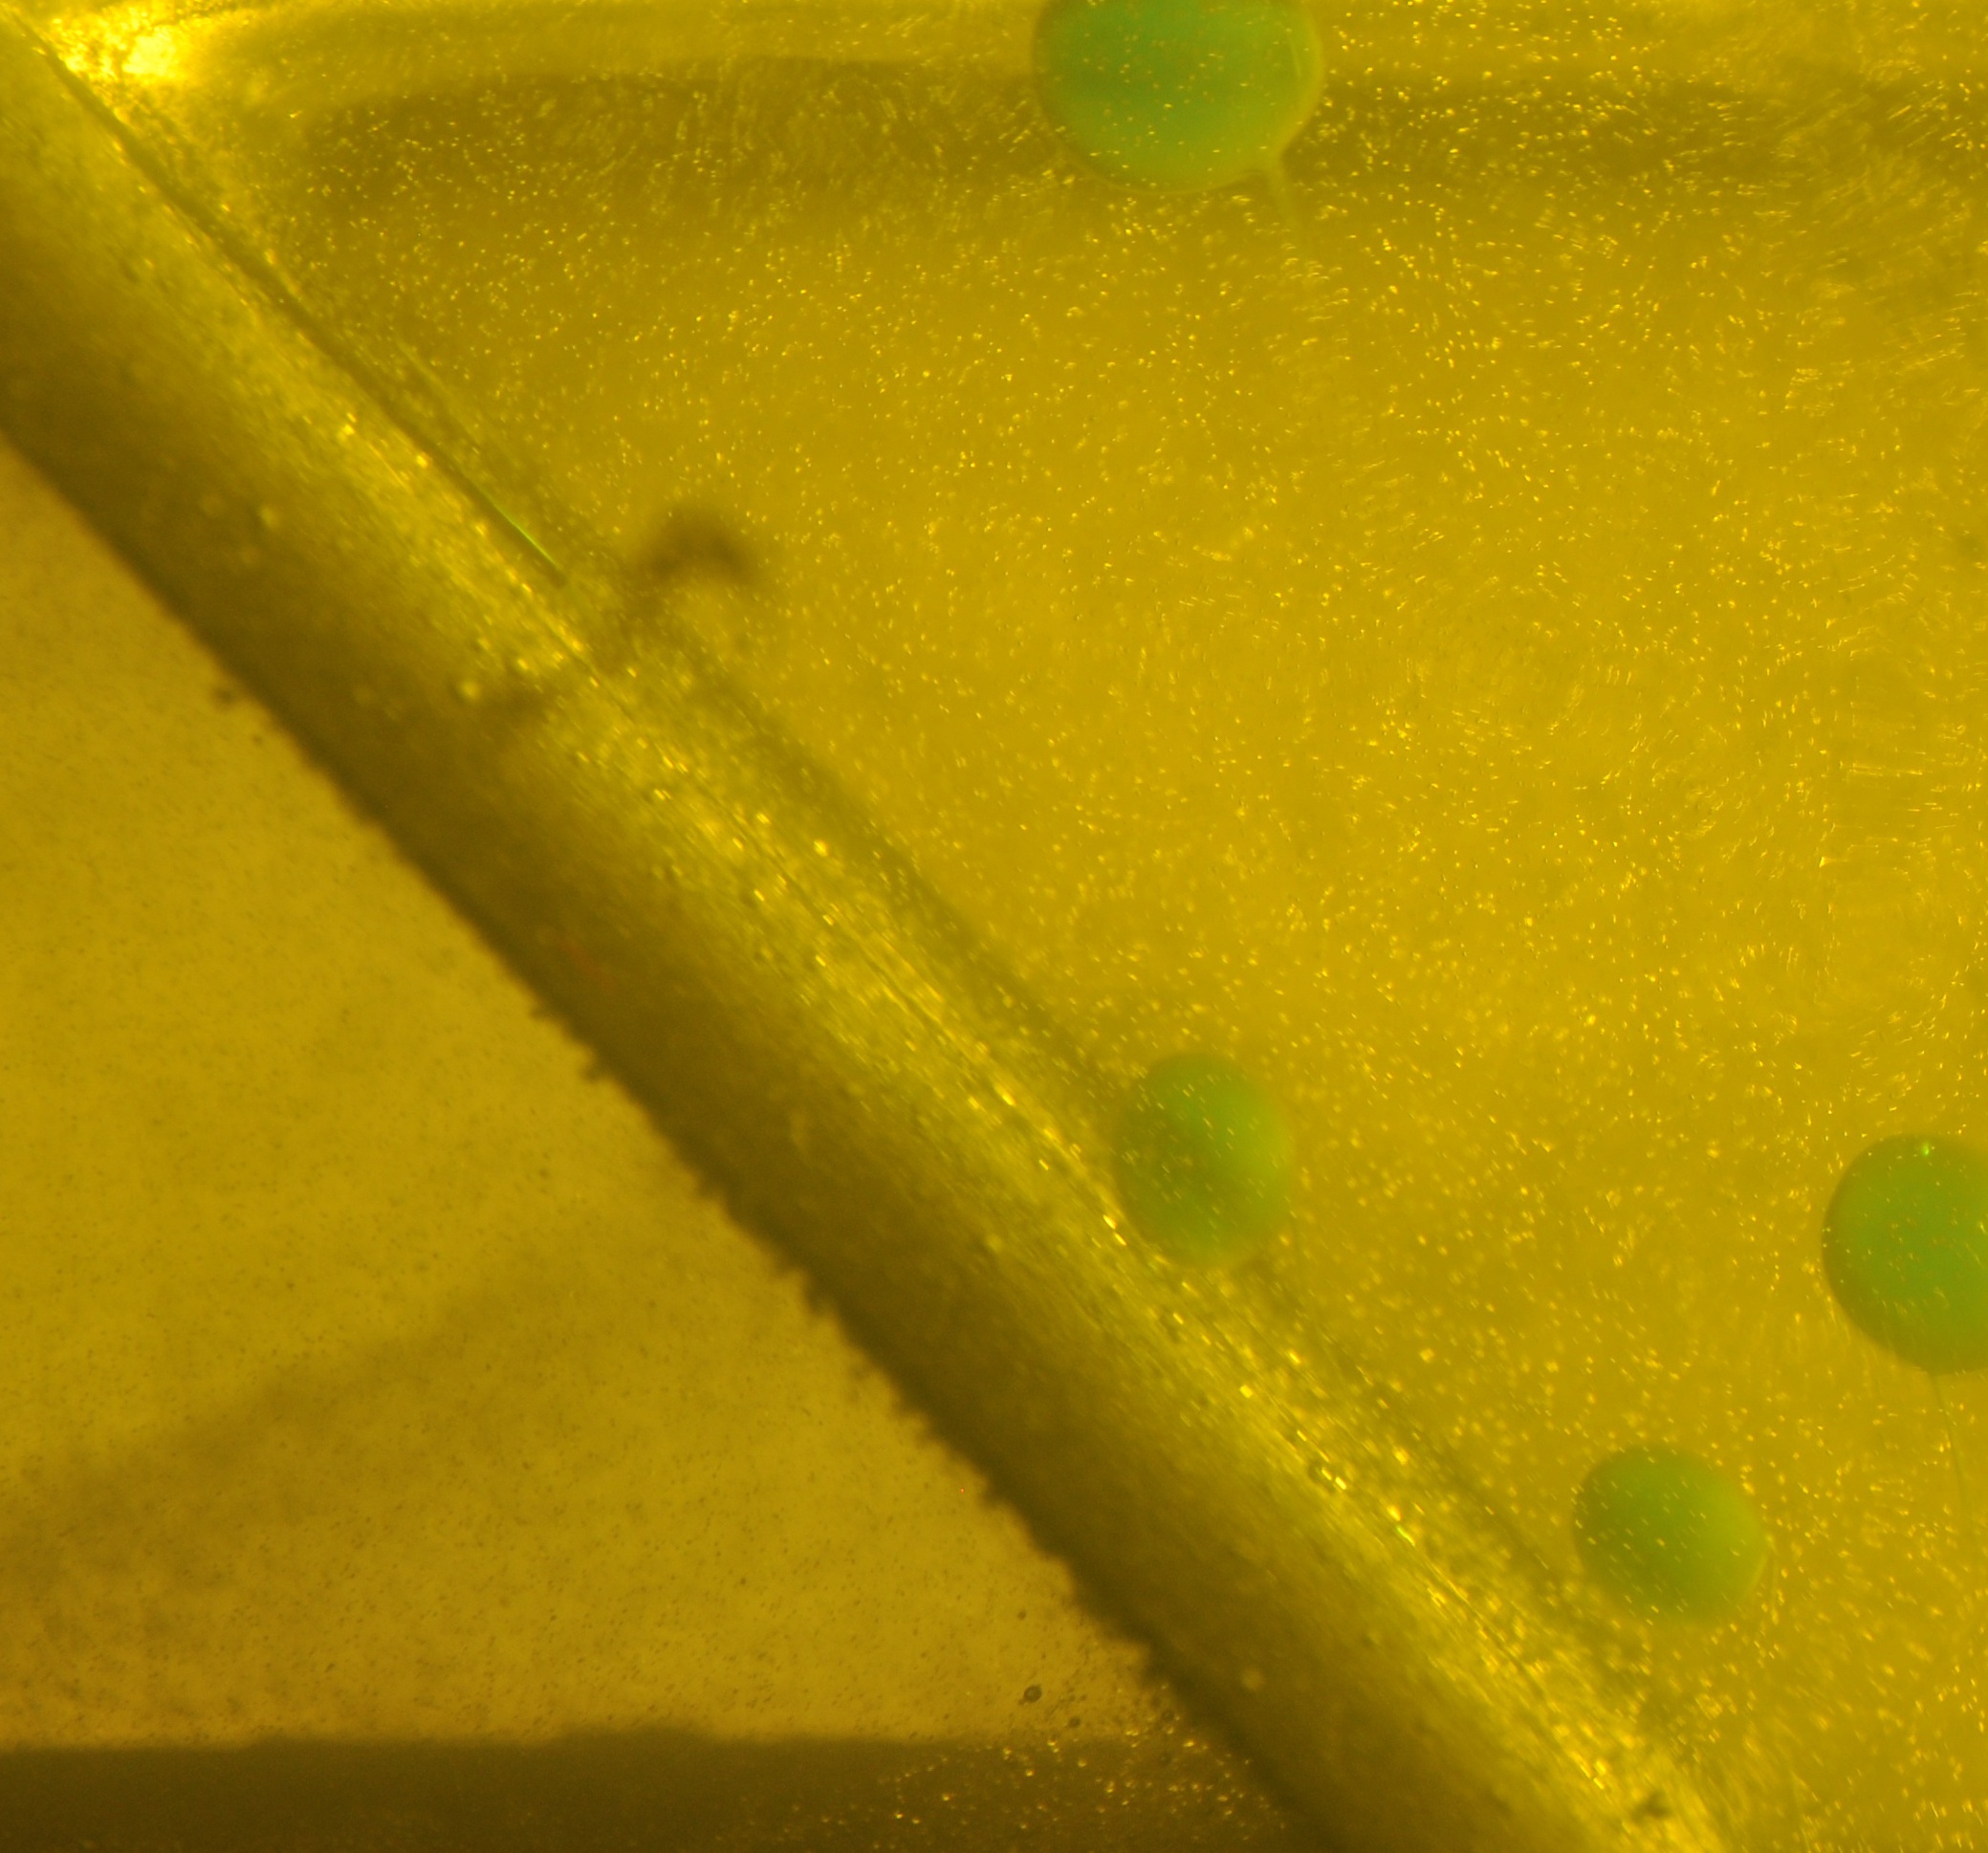
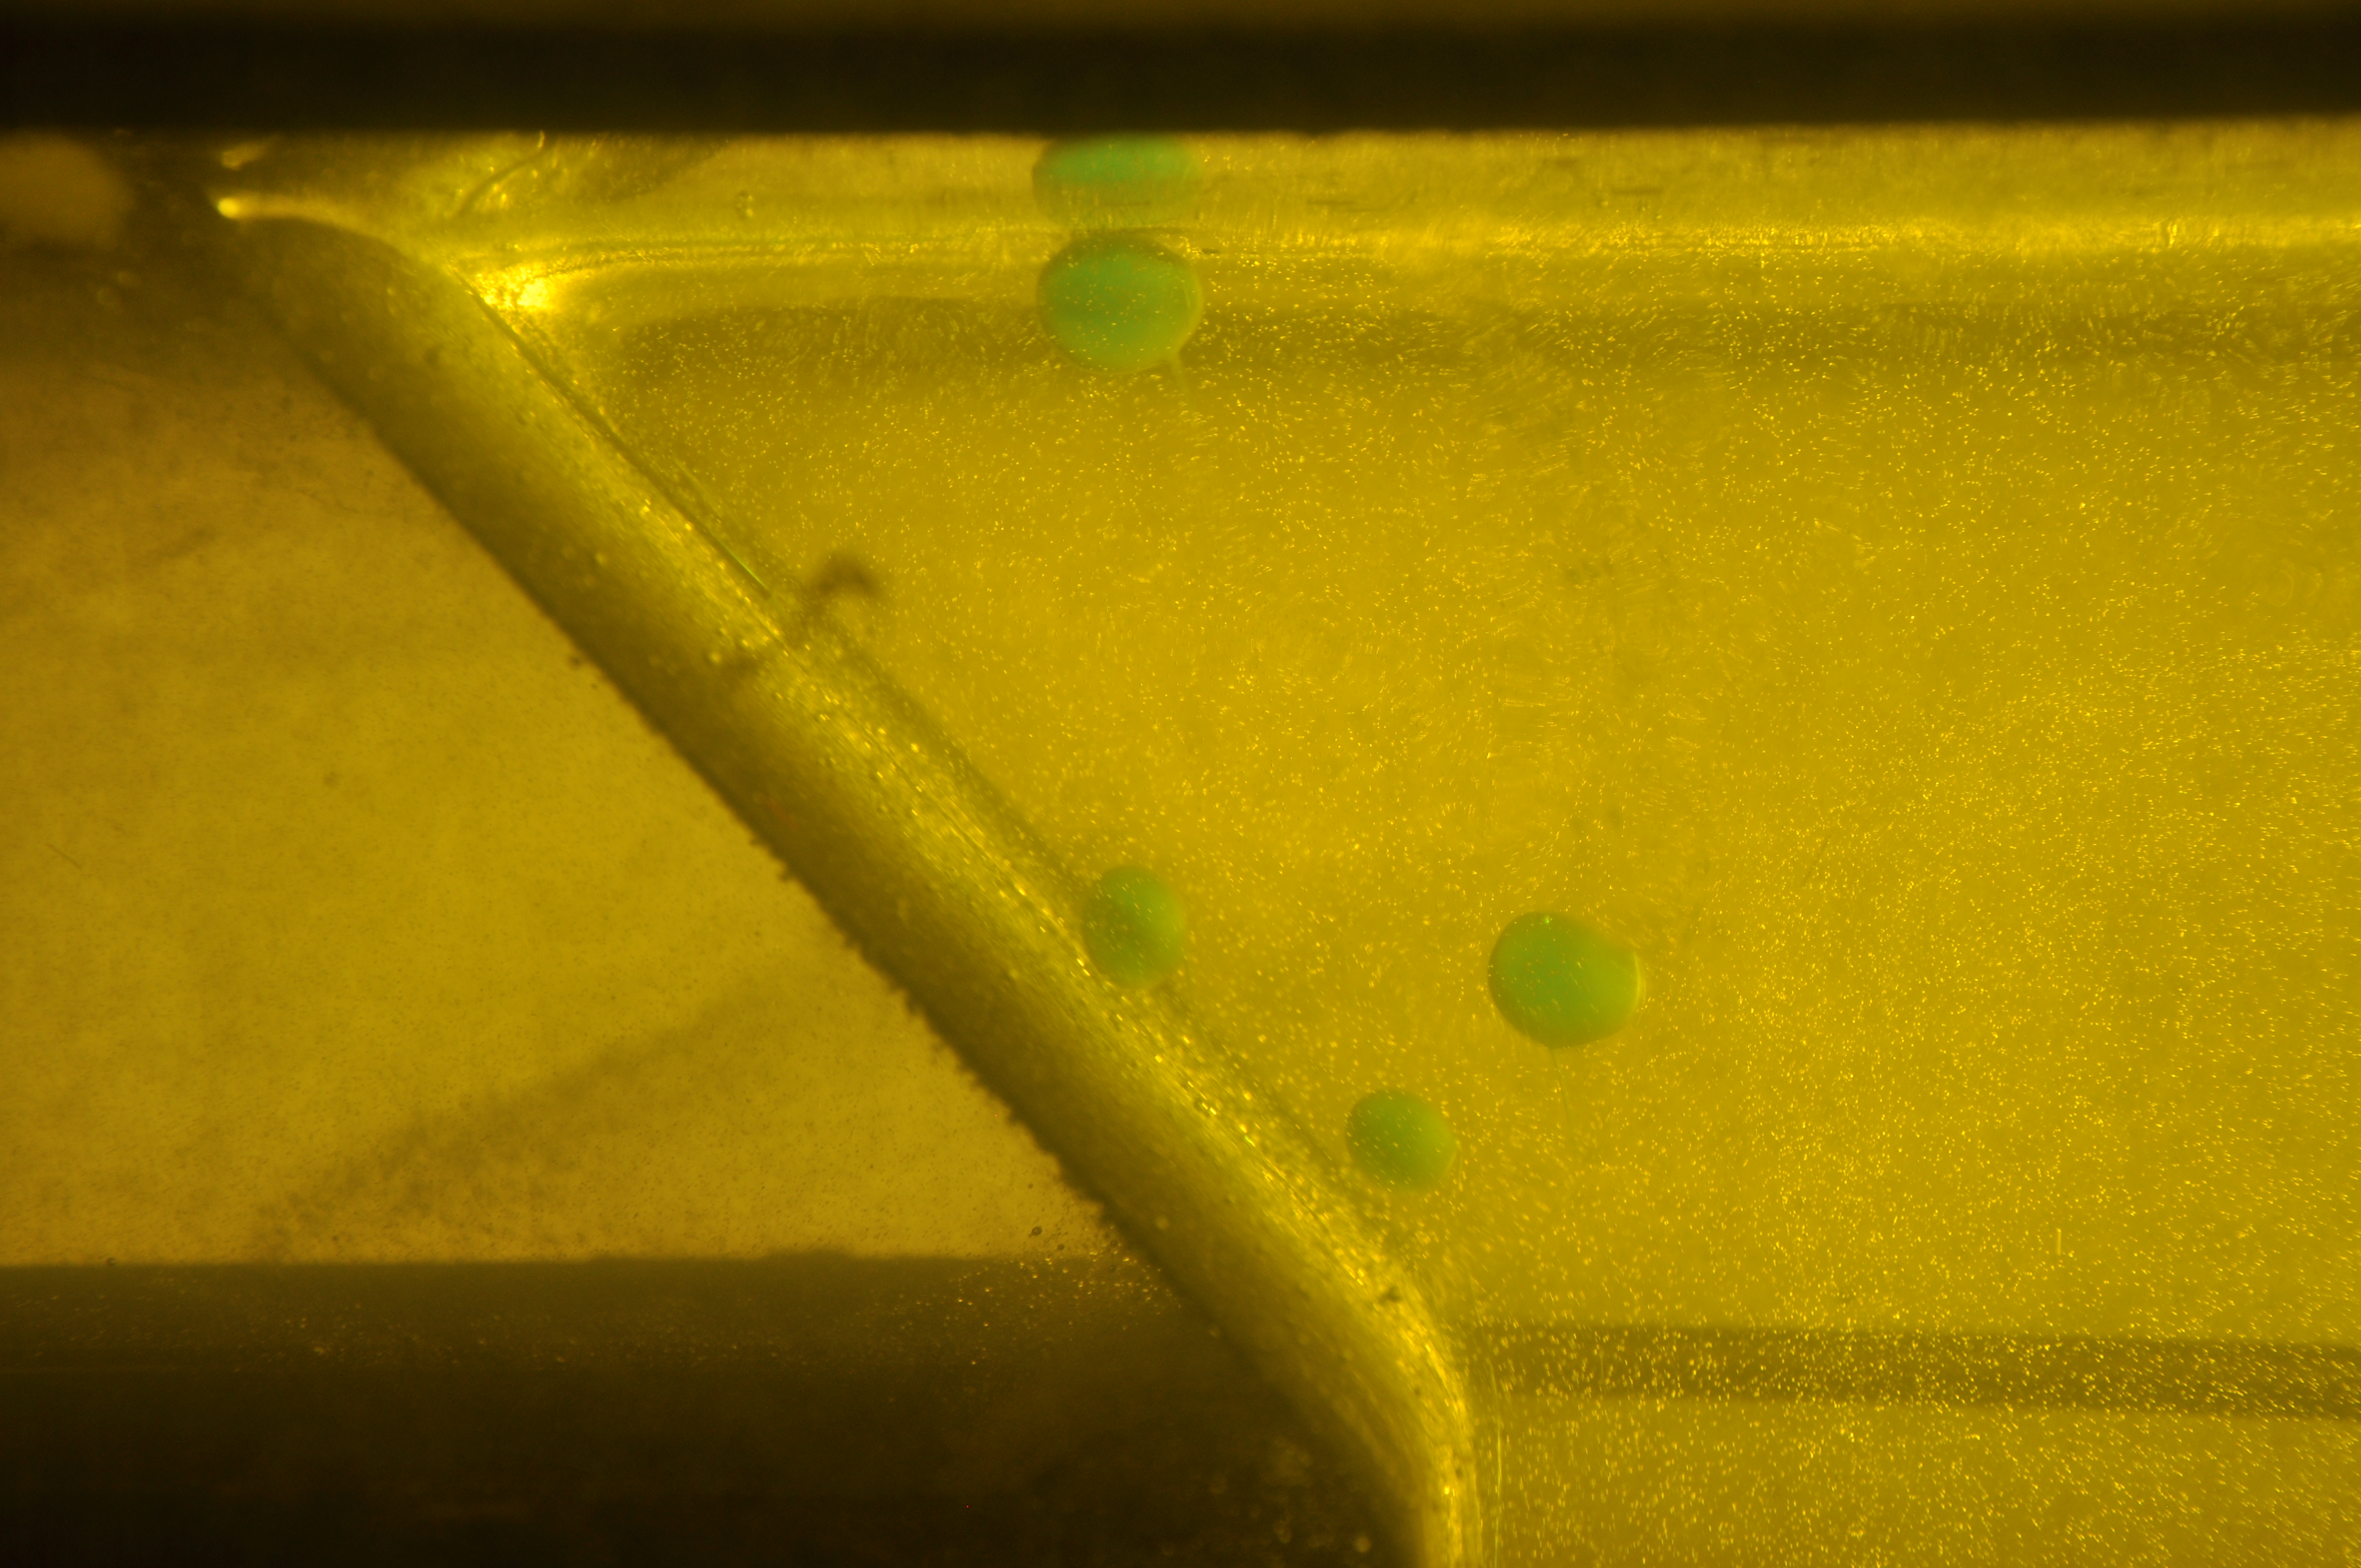
Undistorted image cropped down to ROI. - Step #3 - Convert color spaces and threshold for quick and dirty segmentation of our blobs.
hsvHist.py
returns histograms of the hue, saturation, and value channels. From these we can isolate peaks or reasonable values for our mask. The thresholds on each channel (along with blur and disk-shaped morphological opening) are then tweaked and set with
hsvThreshInteract.py
which allows the user to interact with a simple slider-based GUI to produce an optimal mask for the given experiment, save the parameters, and pass them to
batchThreshold.py
. These thresholding scripts depend on:
- cv2
- numpy
- matplotlib
- argparse
- os
- json
- os
- time
- multiprocessing
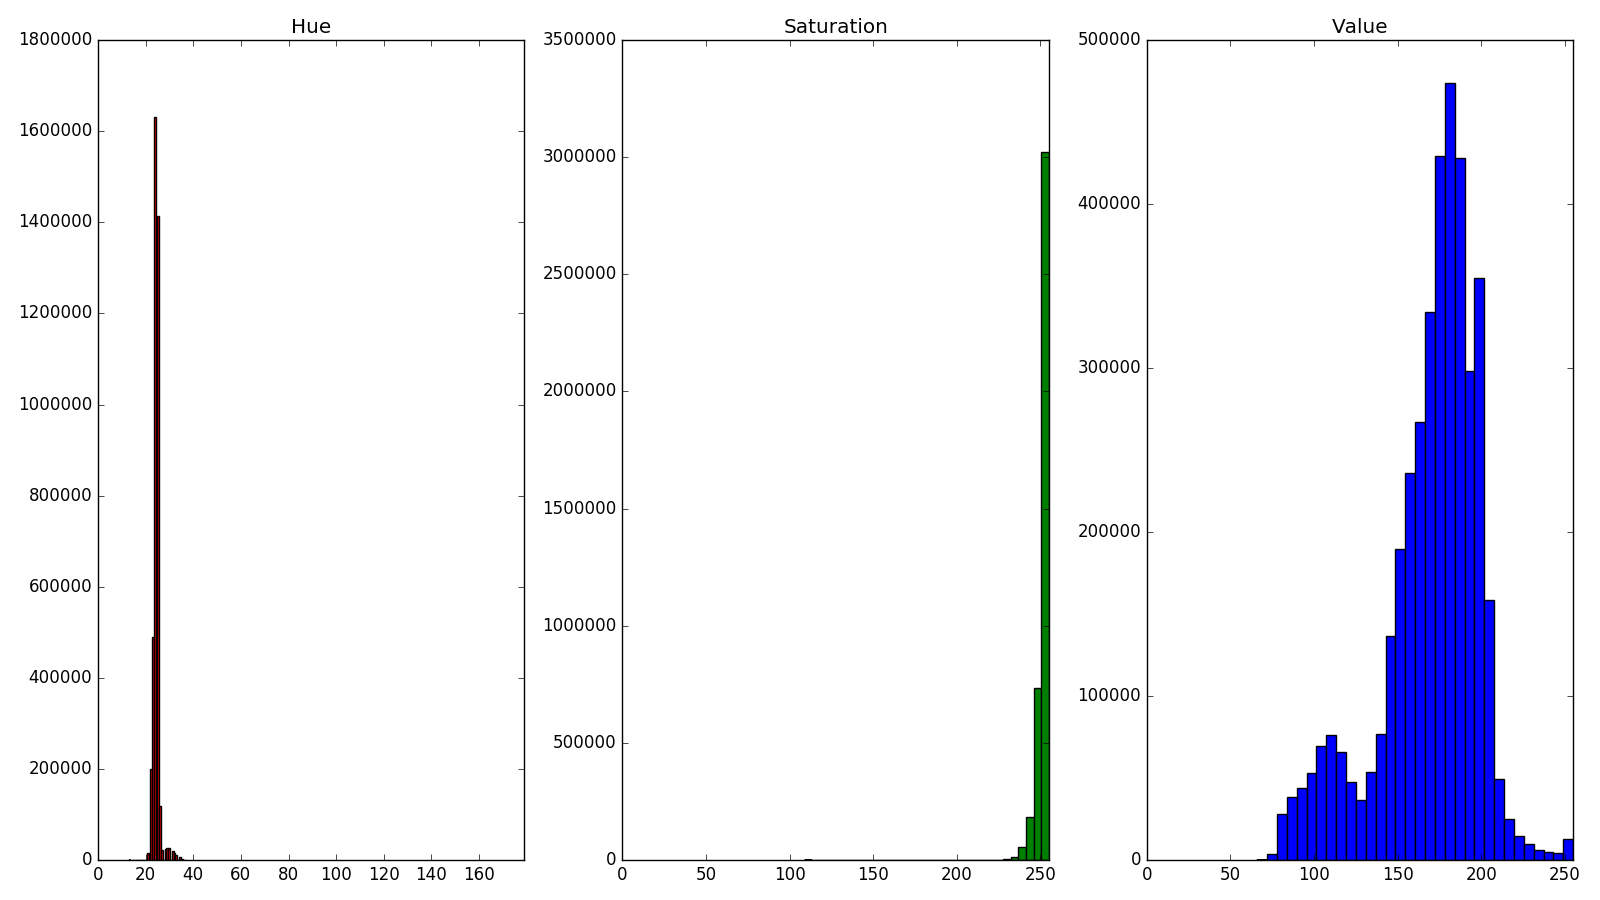
3-channel HSV histograms. 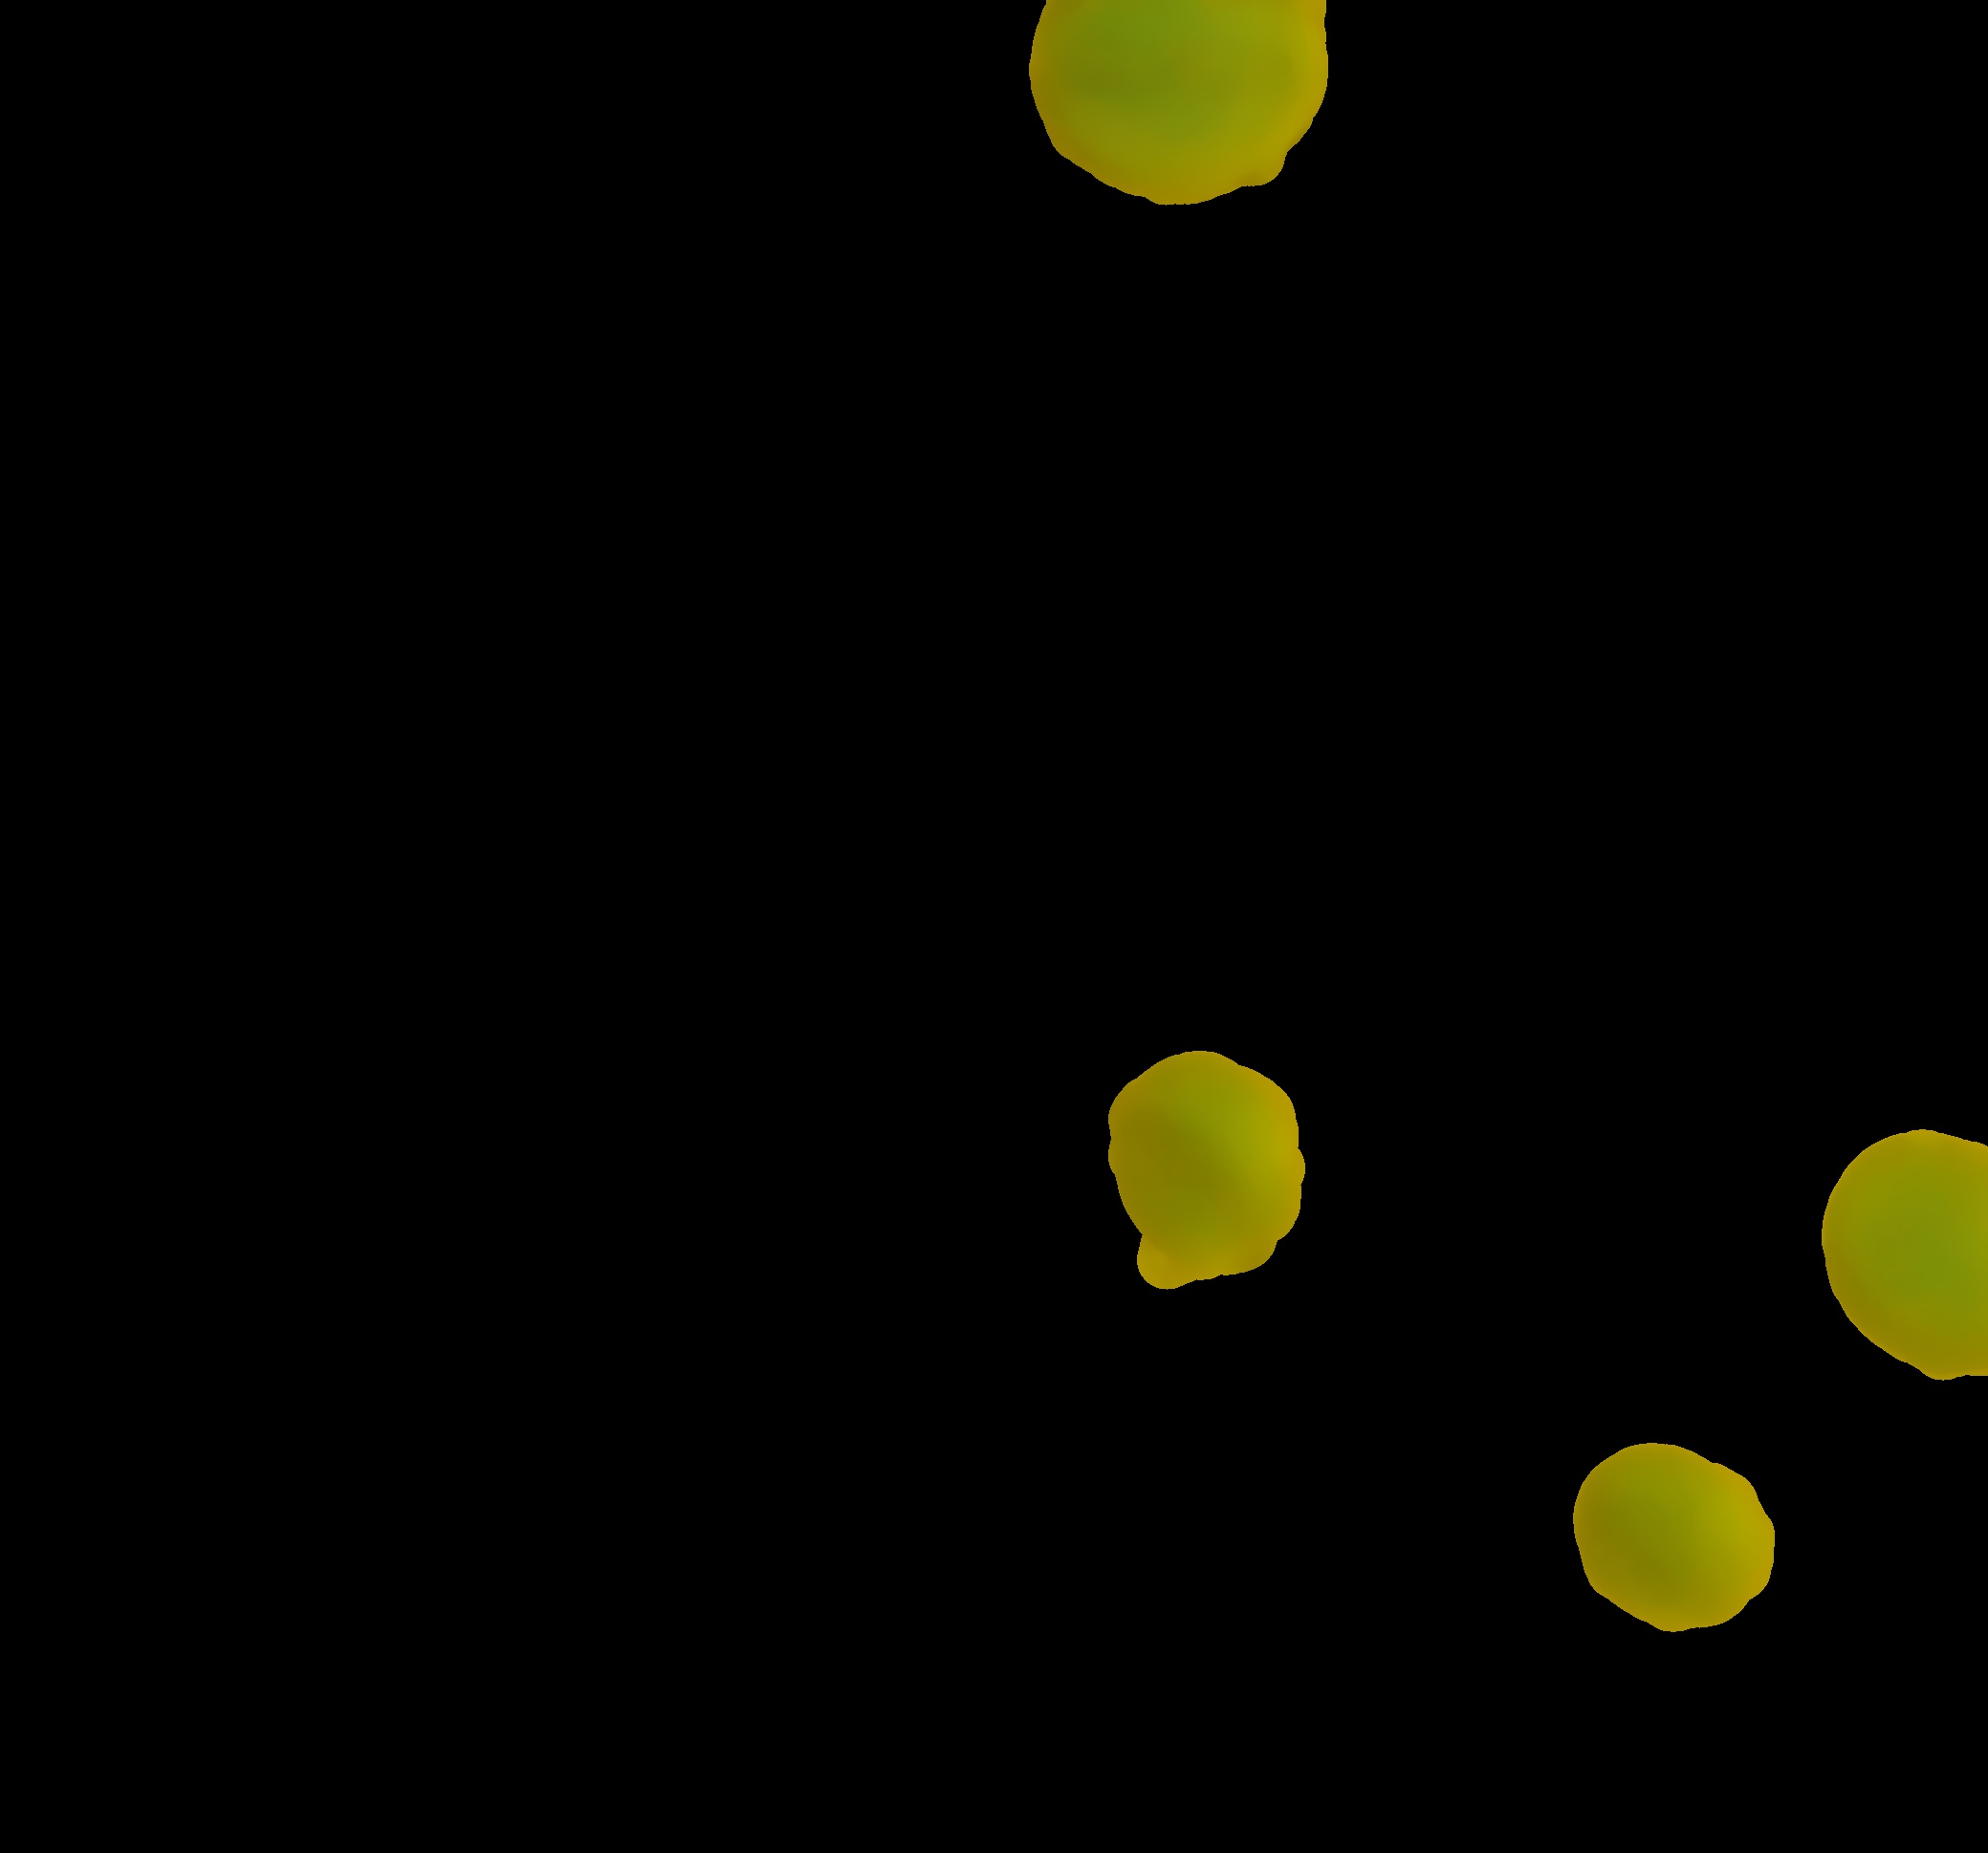
Image with mask applied. - Finally, the masked images of the blobs are passed to
maskTrack.py
which utilizes TrackPy (which has its own suite of dependencies including PyFFTW and Numba) to match and track blobs through subsequent frames and create blob trajectories that are my ultimate goal. This one depends on:
- os
- time
- argparse
- pandas
- matplotlib
- skimage
- trackpy
- pims
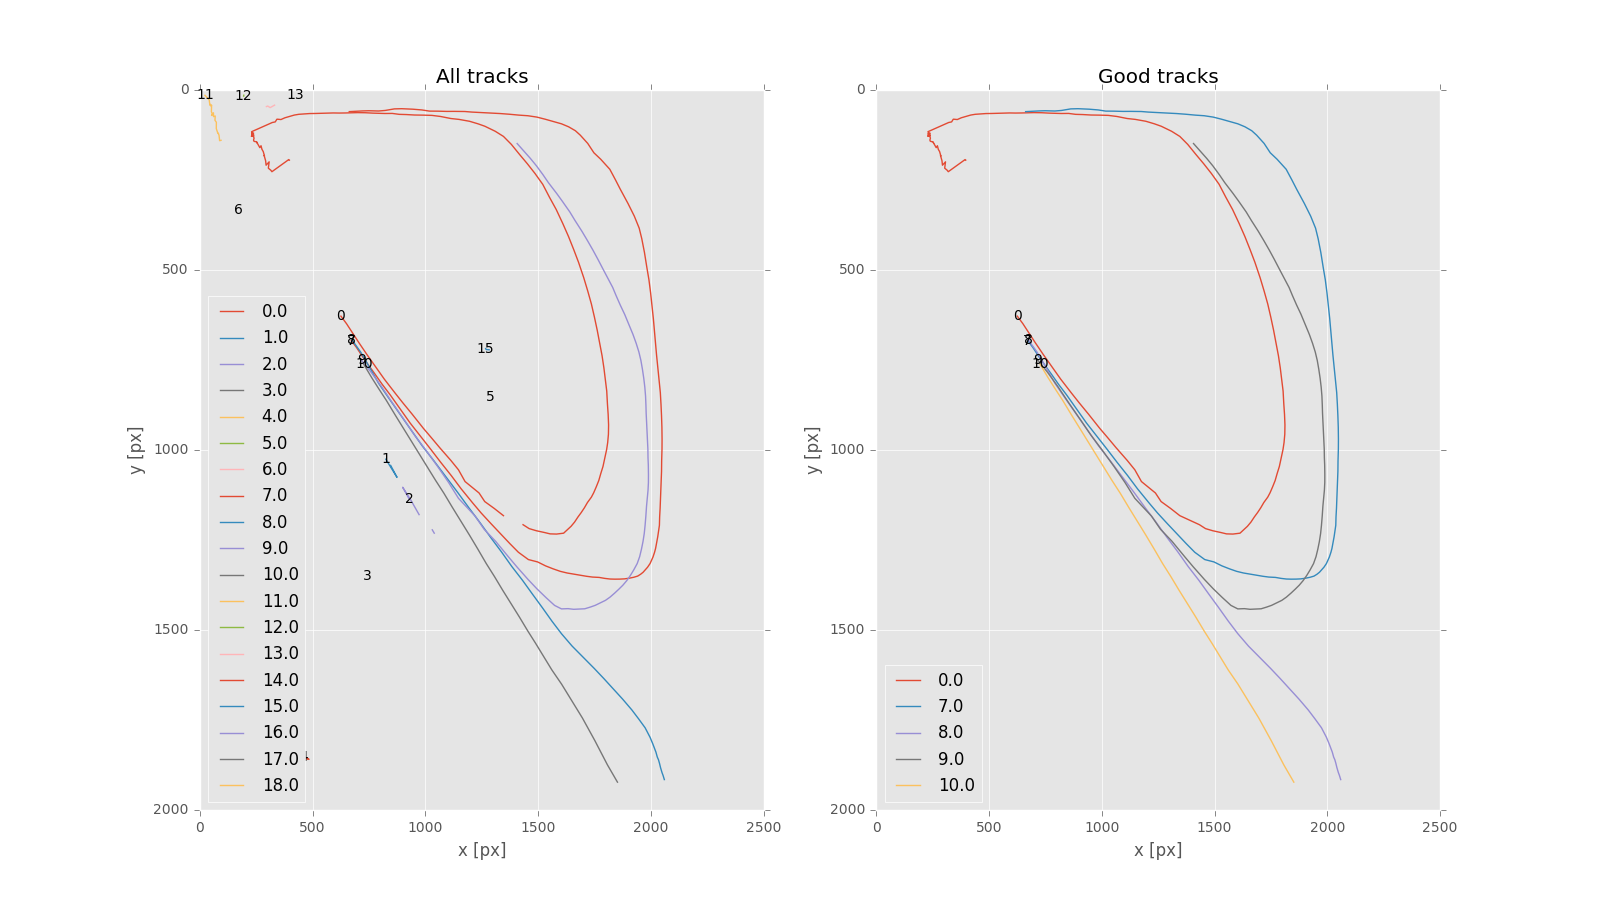
All tracked particle trajectories (left panel) and filtered / sufficiently long trajectories (right panel). - The script
processingDriver.py
glues it all together and creates a single interface to call each of the above in the correct order, allowing for a full experiment to be processed in a few short minutes. It depends on:
- os
- subprocess
Each of these scripts took me a good while to develop and rely heavily on reading blog posts by Adrian Rosebrock at PyImageSearch and Satya Mallic at LearnOpenCV as well as the OpenCV docs, examples, and tutorials, plus countless other individual sites and posts.
I hope you find these scripts useful to adapt for your own use, or as a learning resource in your own R&D process. I will probably try to write a detailed breakdown of each one in future posts, but for now thought just getting this out here would be a good start. Also, I fully intend to post to GitHub and make available that way with more complete documentation to accompany these posts, but again what’s here is better than nothing!