Harnessing open source software and 3D printing technologies to create adaptive solutions for impaired and disabled communities.

A 3D picture is worth way more than a thousand words
First post in a long while, but it only took a few minutes to remember the necessary commands needed to get the site up to date and create content. There’s something to be said for that kind of simplicity and I should document more about how this site works in future posts. Anyway…
First, some context:
I should start by stating that I have lived on an island for my entire life and always actively participated in water sports and appreciated my close proximity to the ocean. In fact, I consider this a dominant factor shaping how and why I have gotten to where I am and decisions I have made along the way.
I began sailing when I was 8 (somewhat begrudgingly which is hard to fathom now, 20 years later…) and that has continued to be my main sport and summer (and sometimes winter) activity. The summer before college was my first year as a sailing instructor, and I have worked for an adaptive sailing program, Sail to Prevail for 4-5 years in Newport and Nantucket, as well as Sail Newport, and additionally coach a high school sailing team. I have been pretty involved in sailing instruction for the past decade, which is part of how this whole project came to be, because this is how I met Matt.
I met Matt 2 or 3 years ago because he wanted to work on short-handed spinnaker sailing to prepare for his summer racing circuit. We would go out double-handed and do half day practices periodically. During one of our practice sessions he asked for clarification about the bathymetry where we sailed and its impact on surface current. The challenging part of coming up with an explanation was that Matt is blind, so he cannot read a typical chart. This was when it became clear that I could probably print a tactile chart for Matt on my 3D printer, a project that became a fantastic culmination of a few different passions of mine… hacking and tinkering, sailing and oceanography, teaching, and I was inspired.
- I wrote another piece about sailing with Matt you can find on his Facebook page.
Back to the actual story:
So, that was a long intro but it frames the rest of the struggle nicely. Initially I did not think that this would be all that challenging. There is a plethora of free and open bathymetry data out there and I assumed someone had come up with slick way to transform various digital elevation model formats into an STL that could then be sliced and printed. I had attempted this once before in grad school when I first got my printer because I thought we could make some neat teaching aids for a set of courses being designed to expose more non-STEM undergraduates to ocean data science. I was unsuccessful then, but now a few years had passed and surely there was an easy way to get this done…
The final solution ended up requiring multiple steps using an interesting combination of some cool software:
- python - common between most of the below mentioned tools
- pyGDAL
- pyNetCDF4
- NumPy
- MatPlotLib
- QGIS - FOSS GIS package with a ton of functionality
- TouchTerrain - converts GeoTIFF to STL
- Cura - still my slicer of choice
Get Data:
I obtained gridded bathymetry data from NarrBay.org which has a ton of data for the bay. I searched RIGIS and NOAA but could not find exactly what I thought I needed. Your mileage may vary for your region of choice. The zip contained an *.e00 file, which I had never run across, so more Google Fu required. Apparently, it’s an old ArcInfo raster format and there are web services that will convert it to whatever you want, but the file was too big to use those for free.
Massage Data:
It took me another couple of tries to figure out how to read and manipulate the *.e00 raster file. First I tried QGIS, a very powerful and complete GIS solution with scripting interfaces and a bunch of plugins, and I really don’t understand all that it’s capable of, but it sort of worked for my task. I was able to open the *.e00 file which is a gridded raster of the bathymetry with NaN’s for land (actually represented as the minimum value of a signed 32 bit integer). This is one area where I wanted to improve in future revisions because all the land masses and islands are presented as holes, which Matt said was somewhat unintuitive. After more Googling and exploring menus I figured out how to crop a region from the entire file and directly export it as a GeoTIFF. I tried changing the NaN / nodata regions a multitude of wys using the built-in raster calculator and transforming to a different layer with a new nodata value but could not get an array that worked correctly.
The next stage in the solution was to read and manipulate the data directly with python which actually turned out to work really well. GDAL can open the weird raster format as well as GeoTiff’s of various regions I had exported from QGIS, and I found a NetCDF of the data from NOAA that was way easier for me to work with because I use that format regularly. I was able to slice an ROI from a NumPY array, mask the NaN’s and change their value to whatever I wanted and dump the array back to the disk as a GeoTIFF in less than 20 lines in a notebook. I sould have known this was the right solution from the beginning. Now I just had to turn my DEM raster into something printable.
DEM –> STL:
I attempted to use a plugin called DEMto3D but was unable to get it to work properly. Next came TouchTerrain from the GeoFabLab at Iowa State, here is the paper they wrote about it. I had used the TouchTerrain web interface in the past to print a model of Mt. Katahdin but was unable to get it to work for negative topography because of the USGS DEM they use. As of the 2.0 release the developers also provide a standalone python version that you can get from their GitHub page to run on your own data. This works perfectly and yields a binary (or ASCII) STL that you can then feed to your slicer of choice.
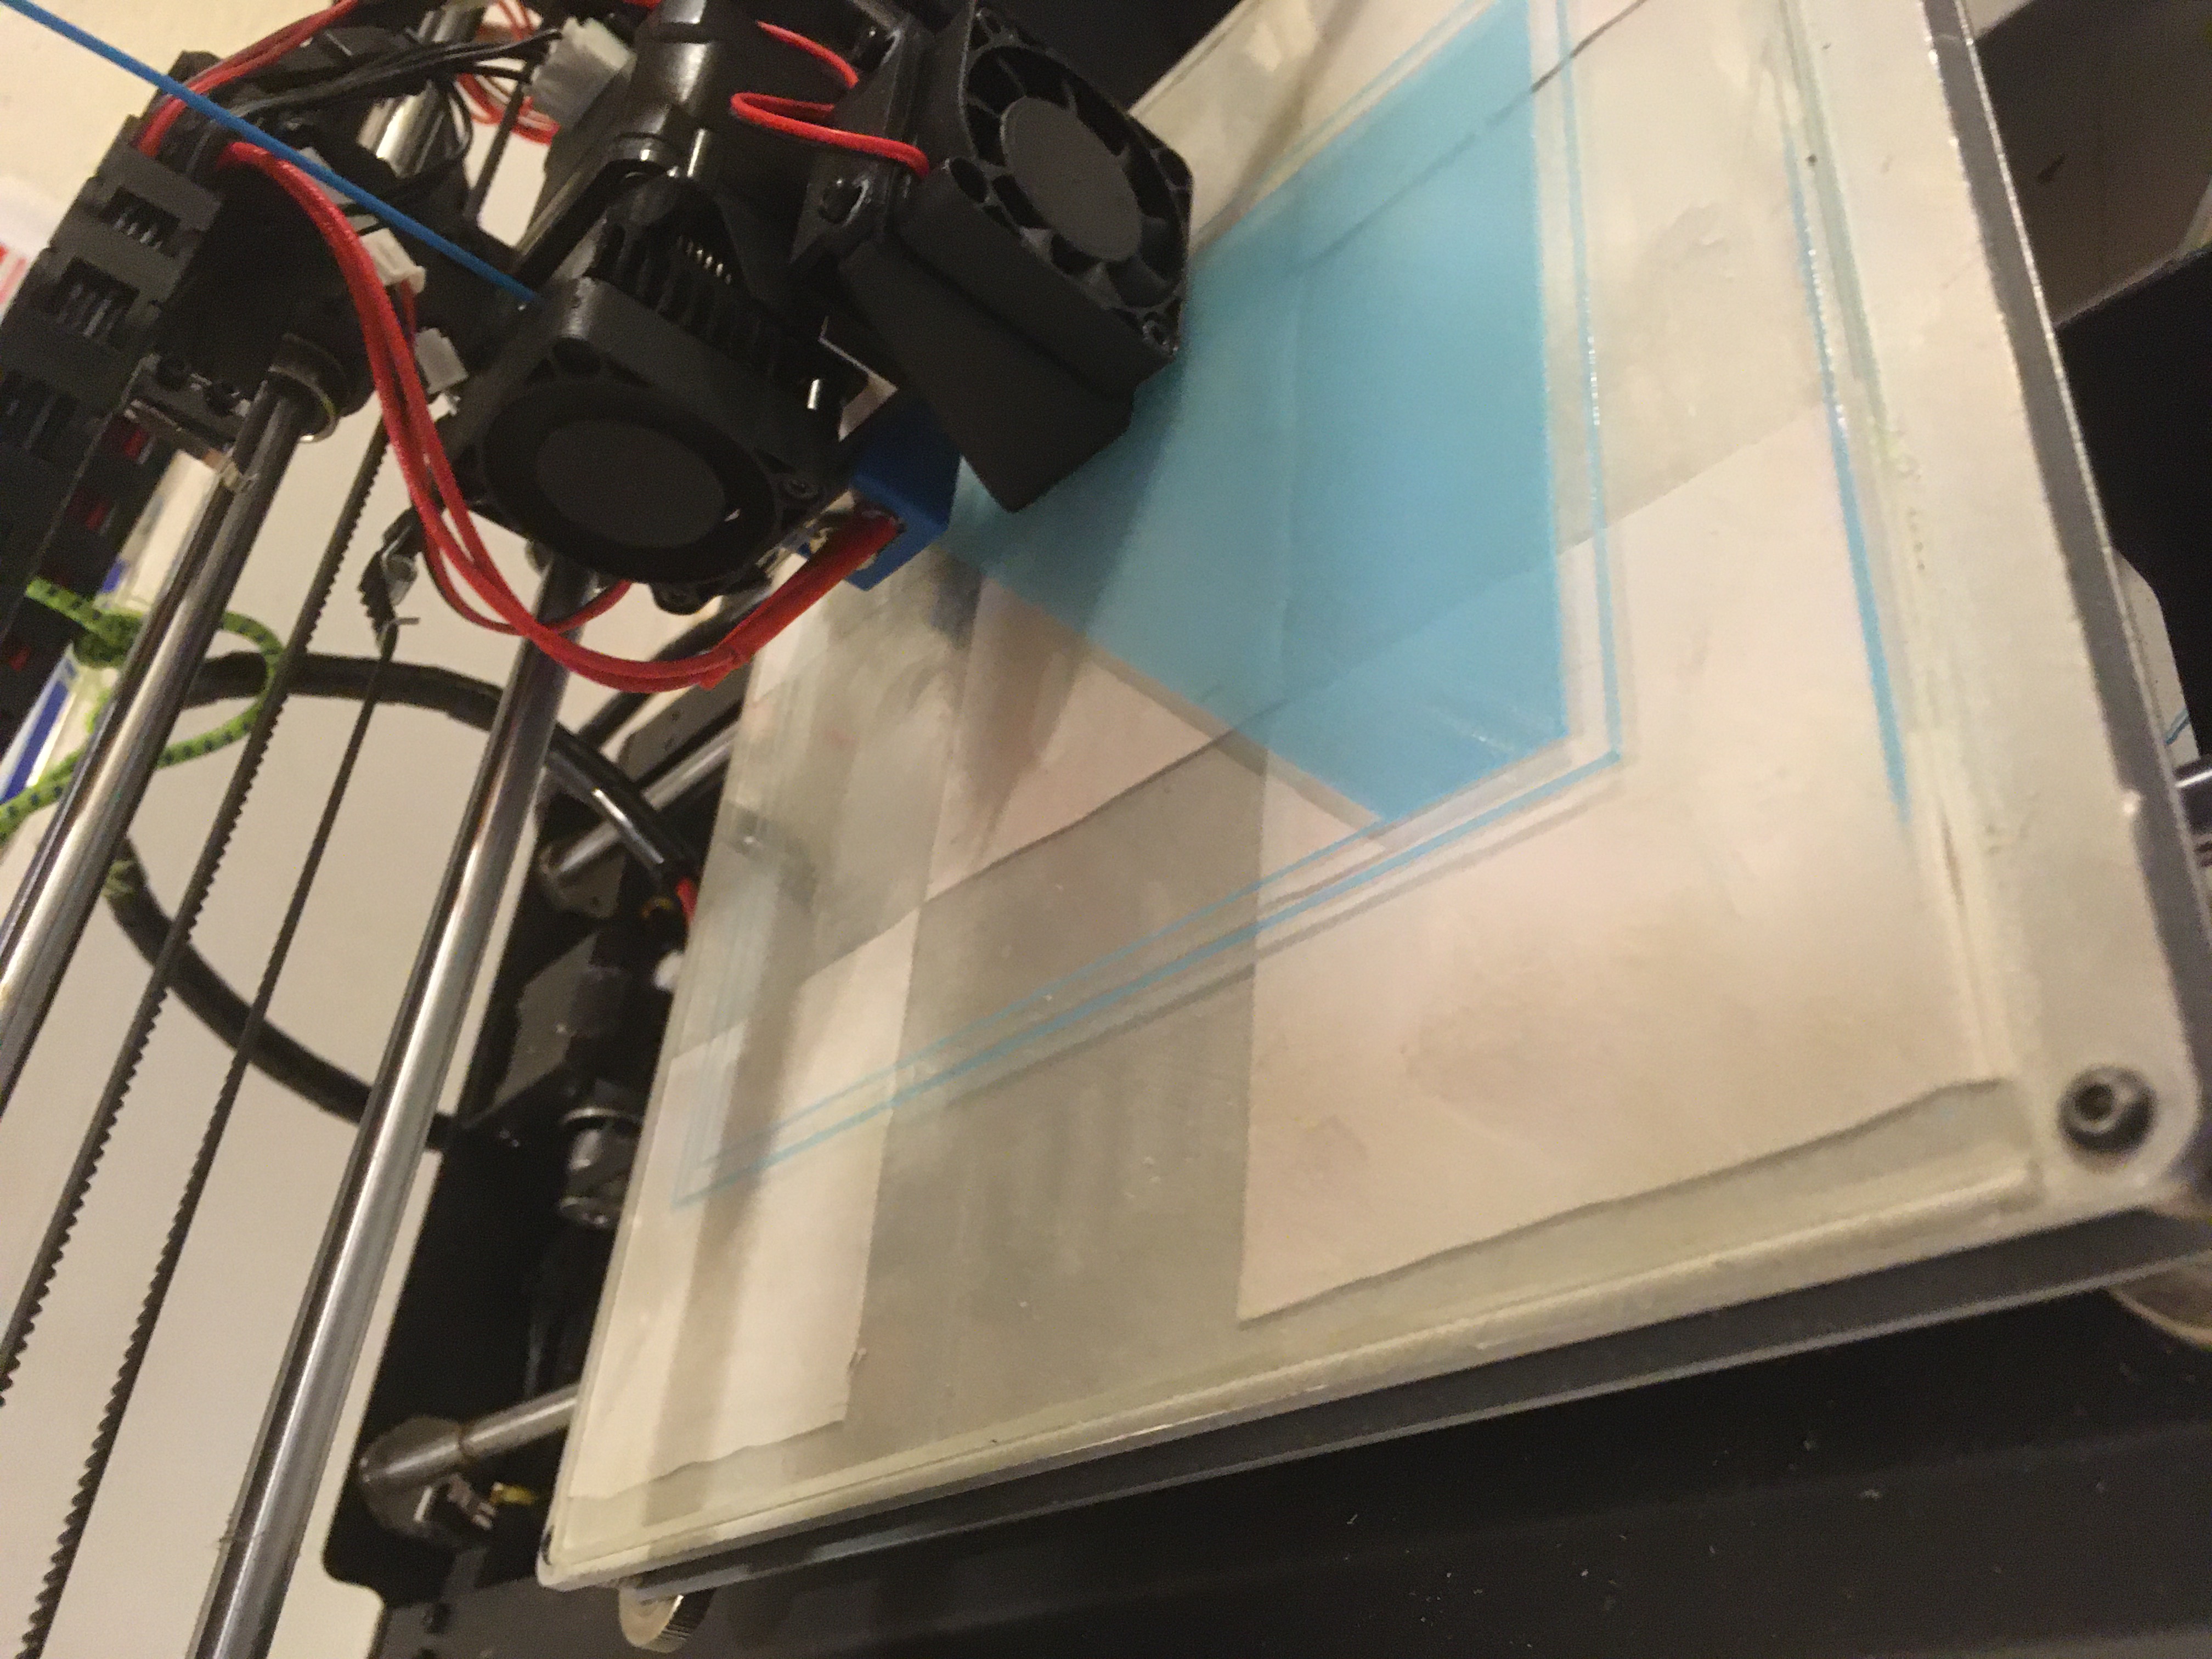
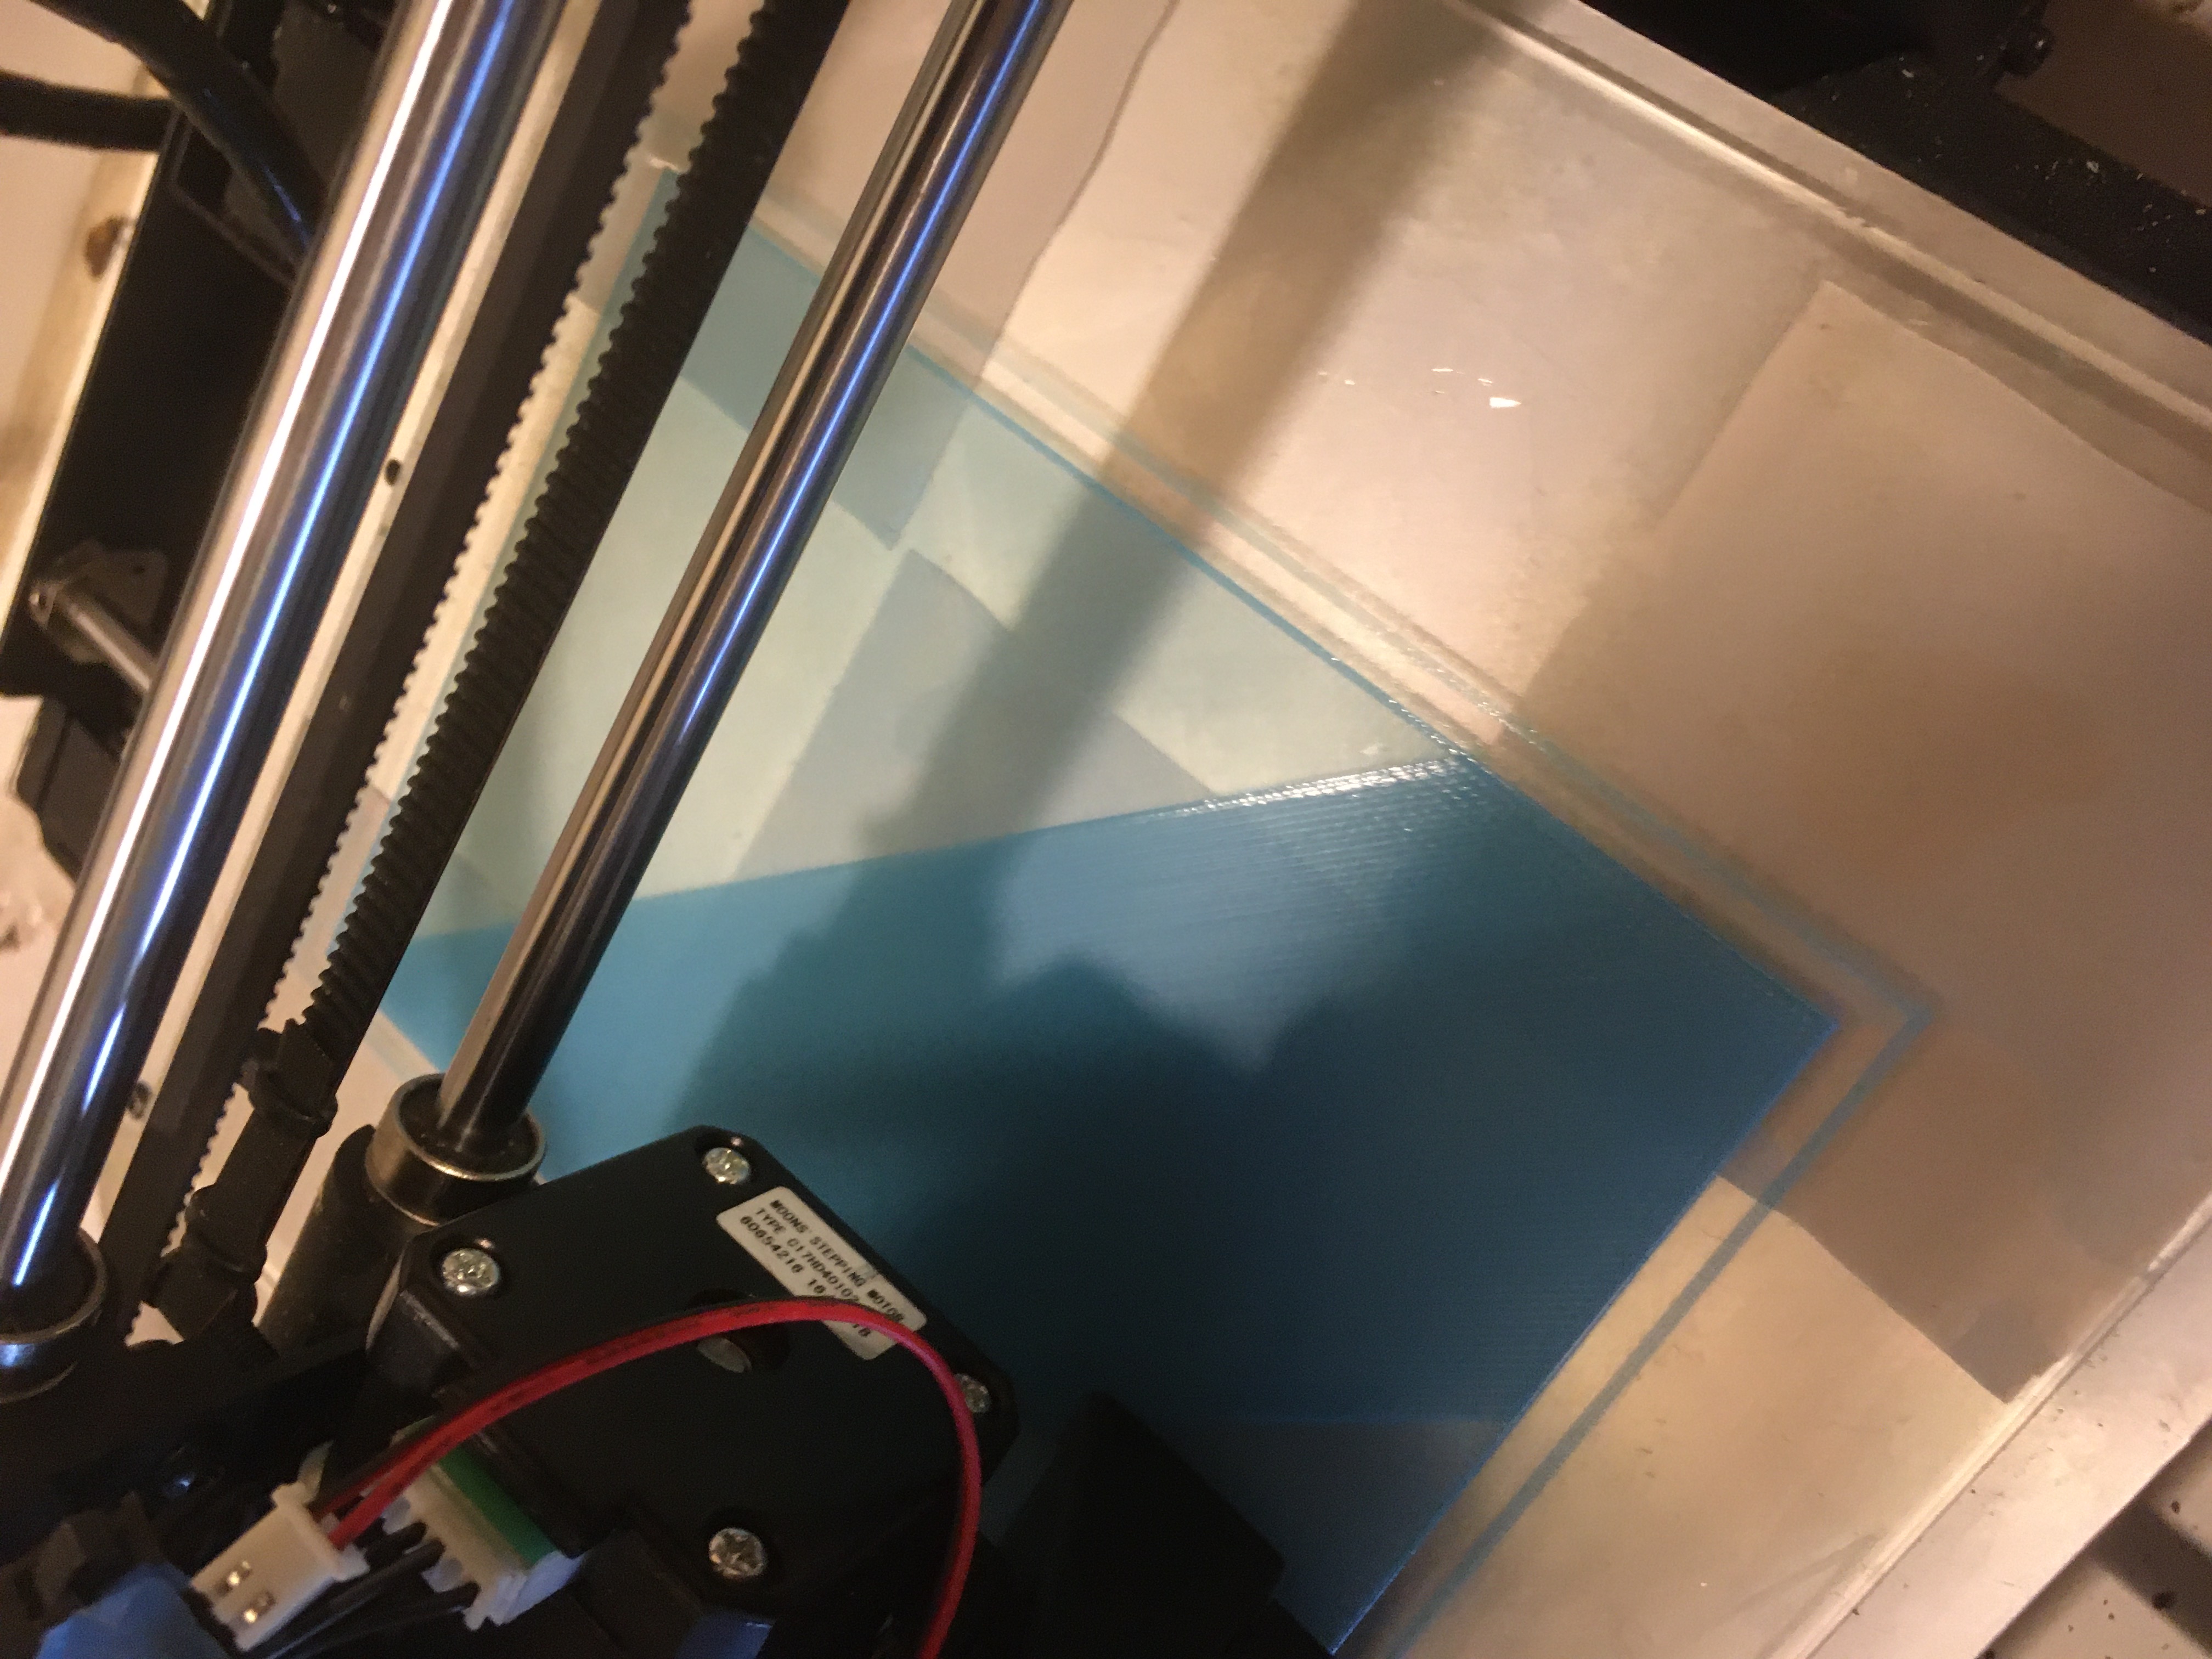
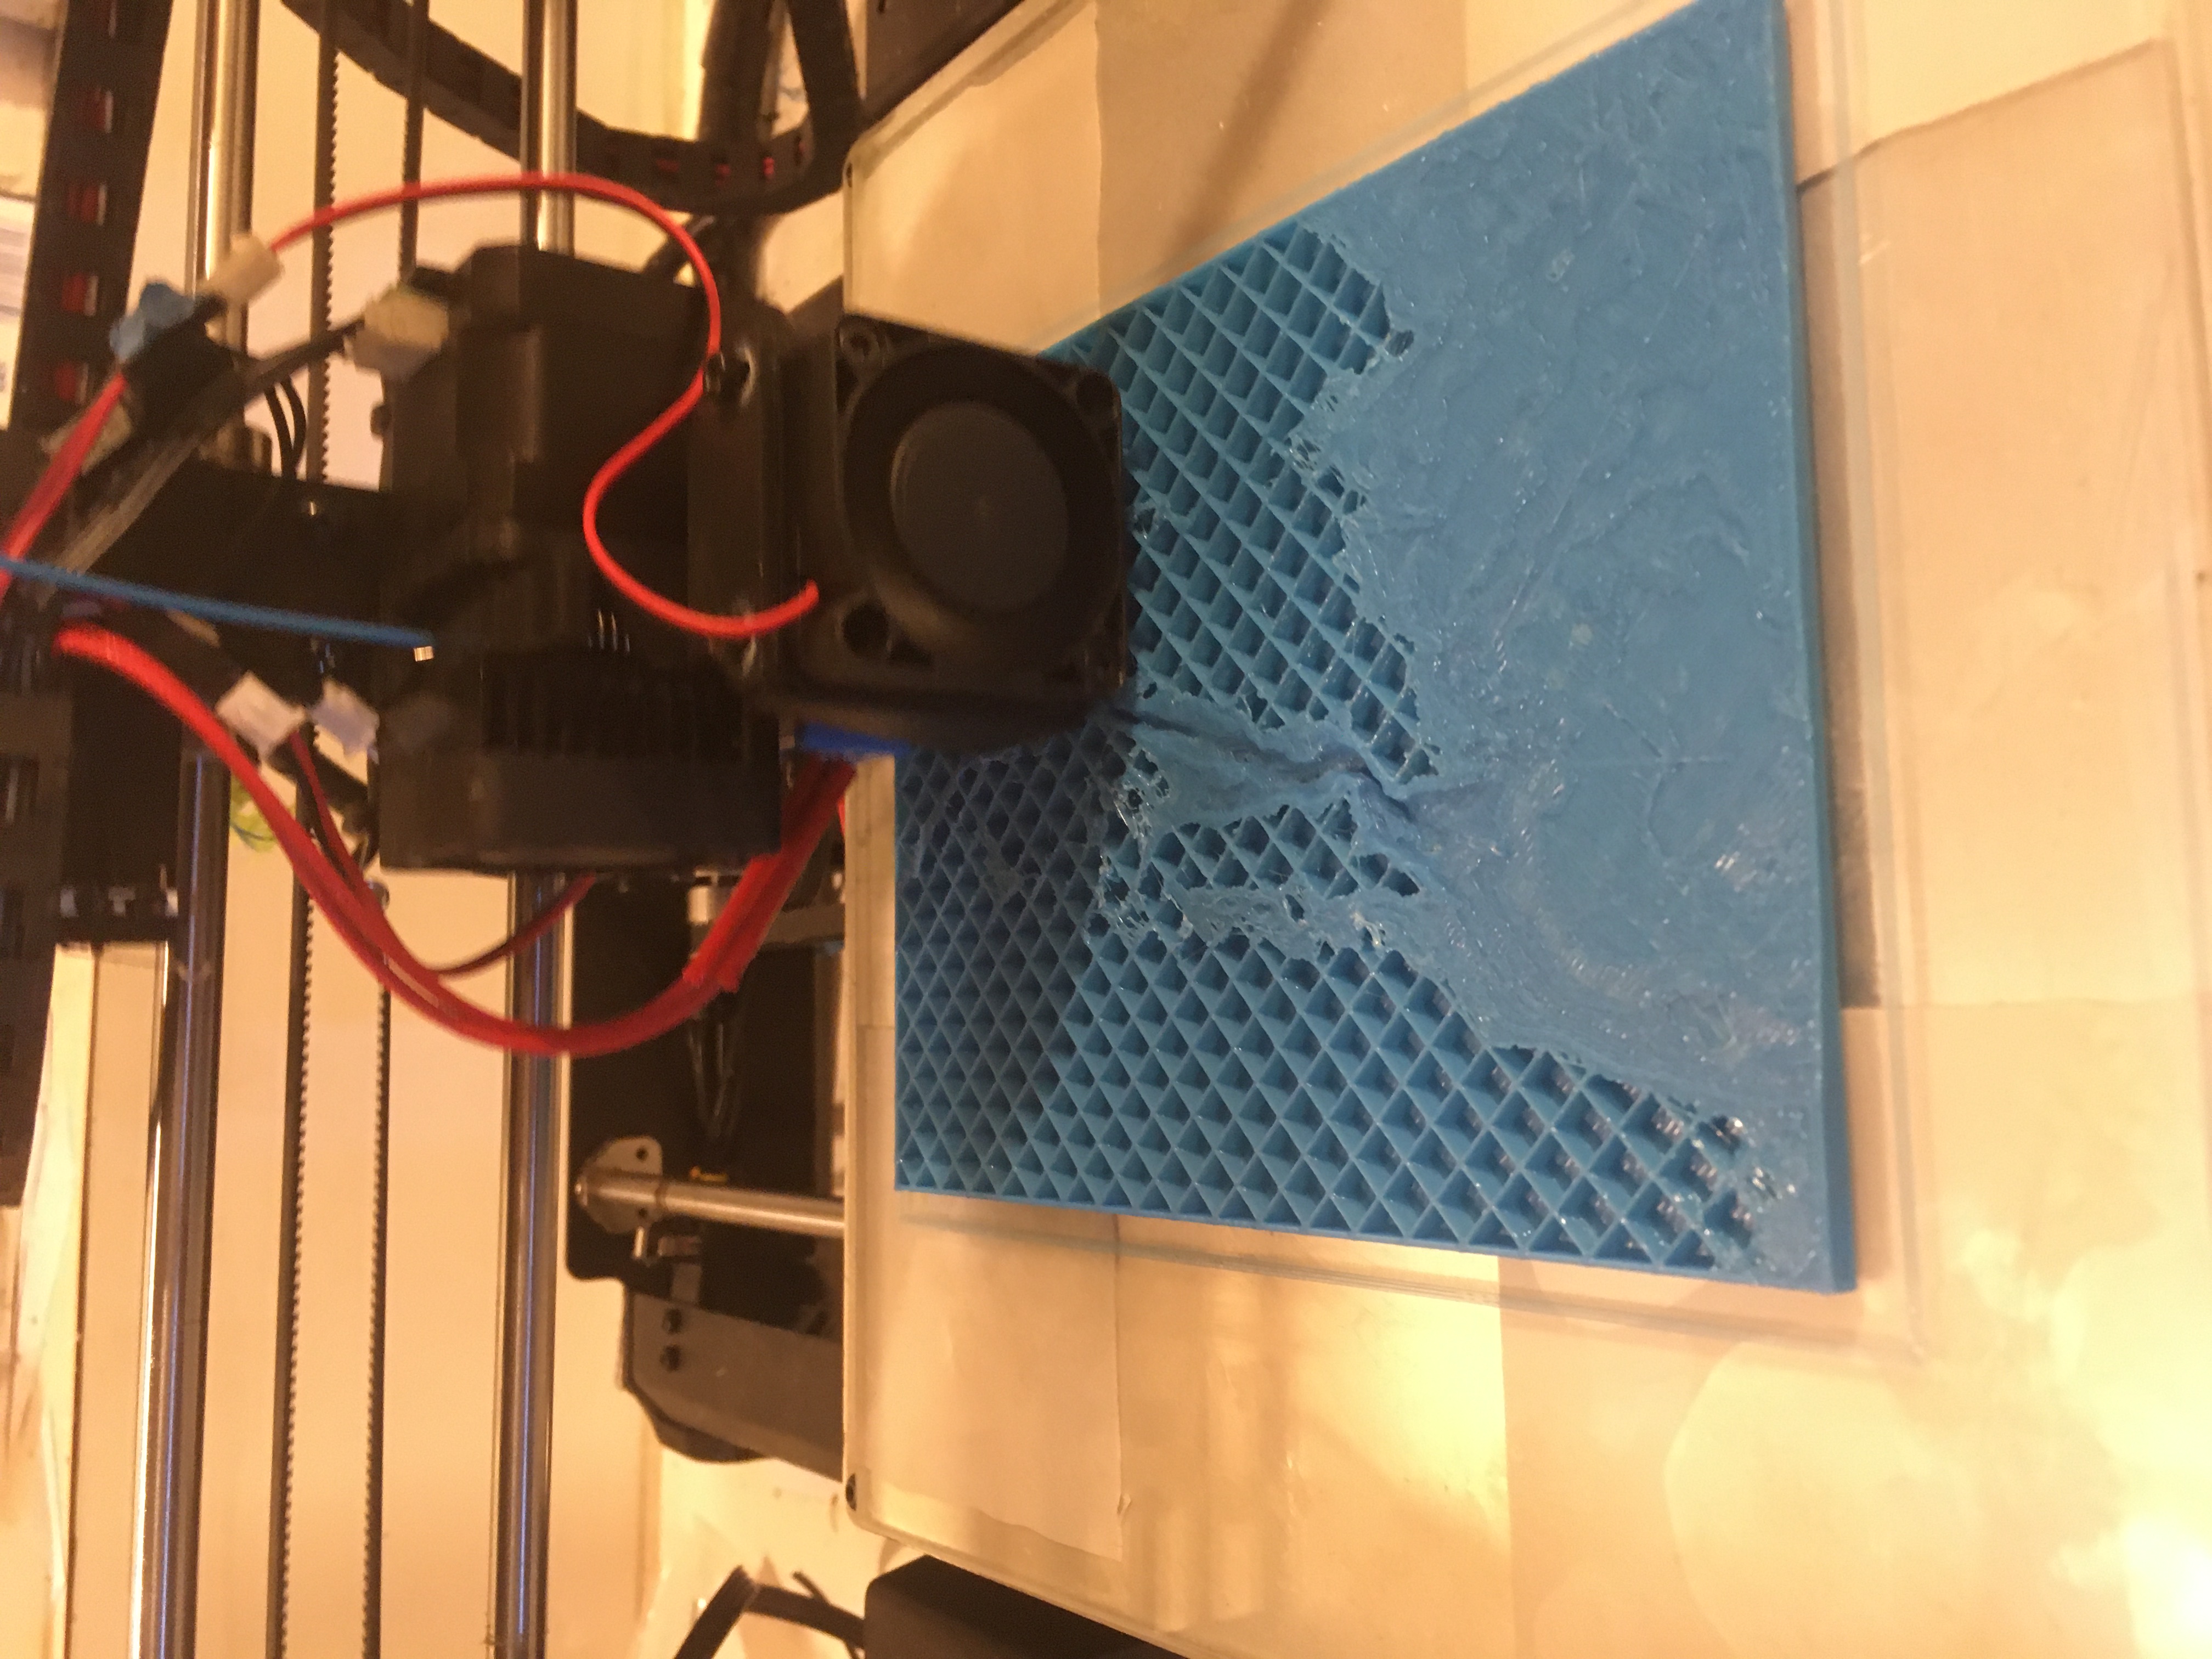
Print!
The results were impressive and I can’t wait to create more of these!

Hopefully this post gave some information to those out there looking for ways to 3D print representations of digital elevation models for whatever purpose. For me, these types of models represent valuable teaching aids and provide a fantastic mechanism for assisting visually impaired people with understanding the world around them.