In the modern technological era dominated by big-data and the surveilance state, scientific measurements are still surprisingly sparse in space and time.
Sources: Phys.org (where I saw it) and the Original
Nice View!
The above photo (well technically it’s probably a pseudo-color image) caught my eye as I was browsing through my news feed (I use Feedly). I have seen a lot of satellite imagery and am familiar with the interpretation and usefulness of this data. Sometimes these remarkable tools yield fields that are visually striking.
First, A Geological Aside:
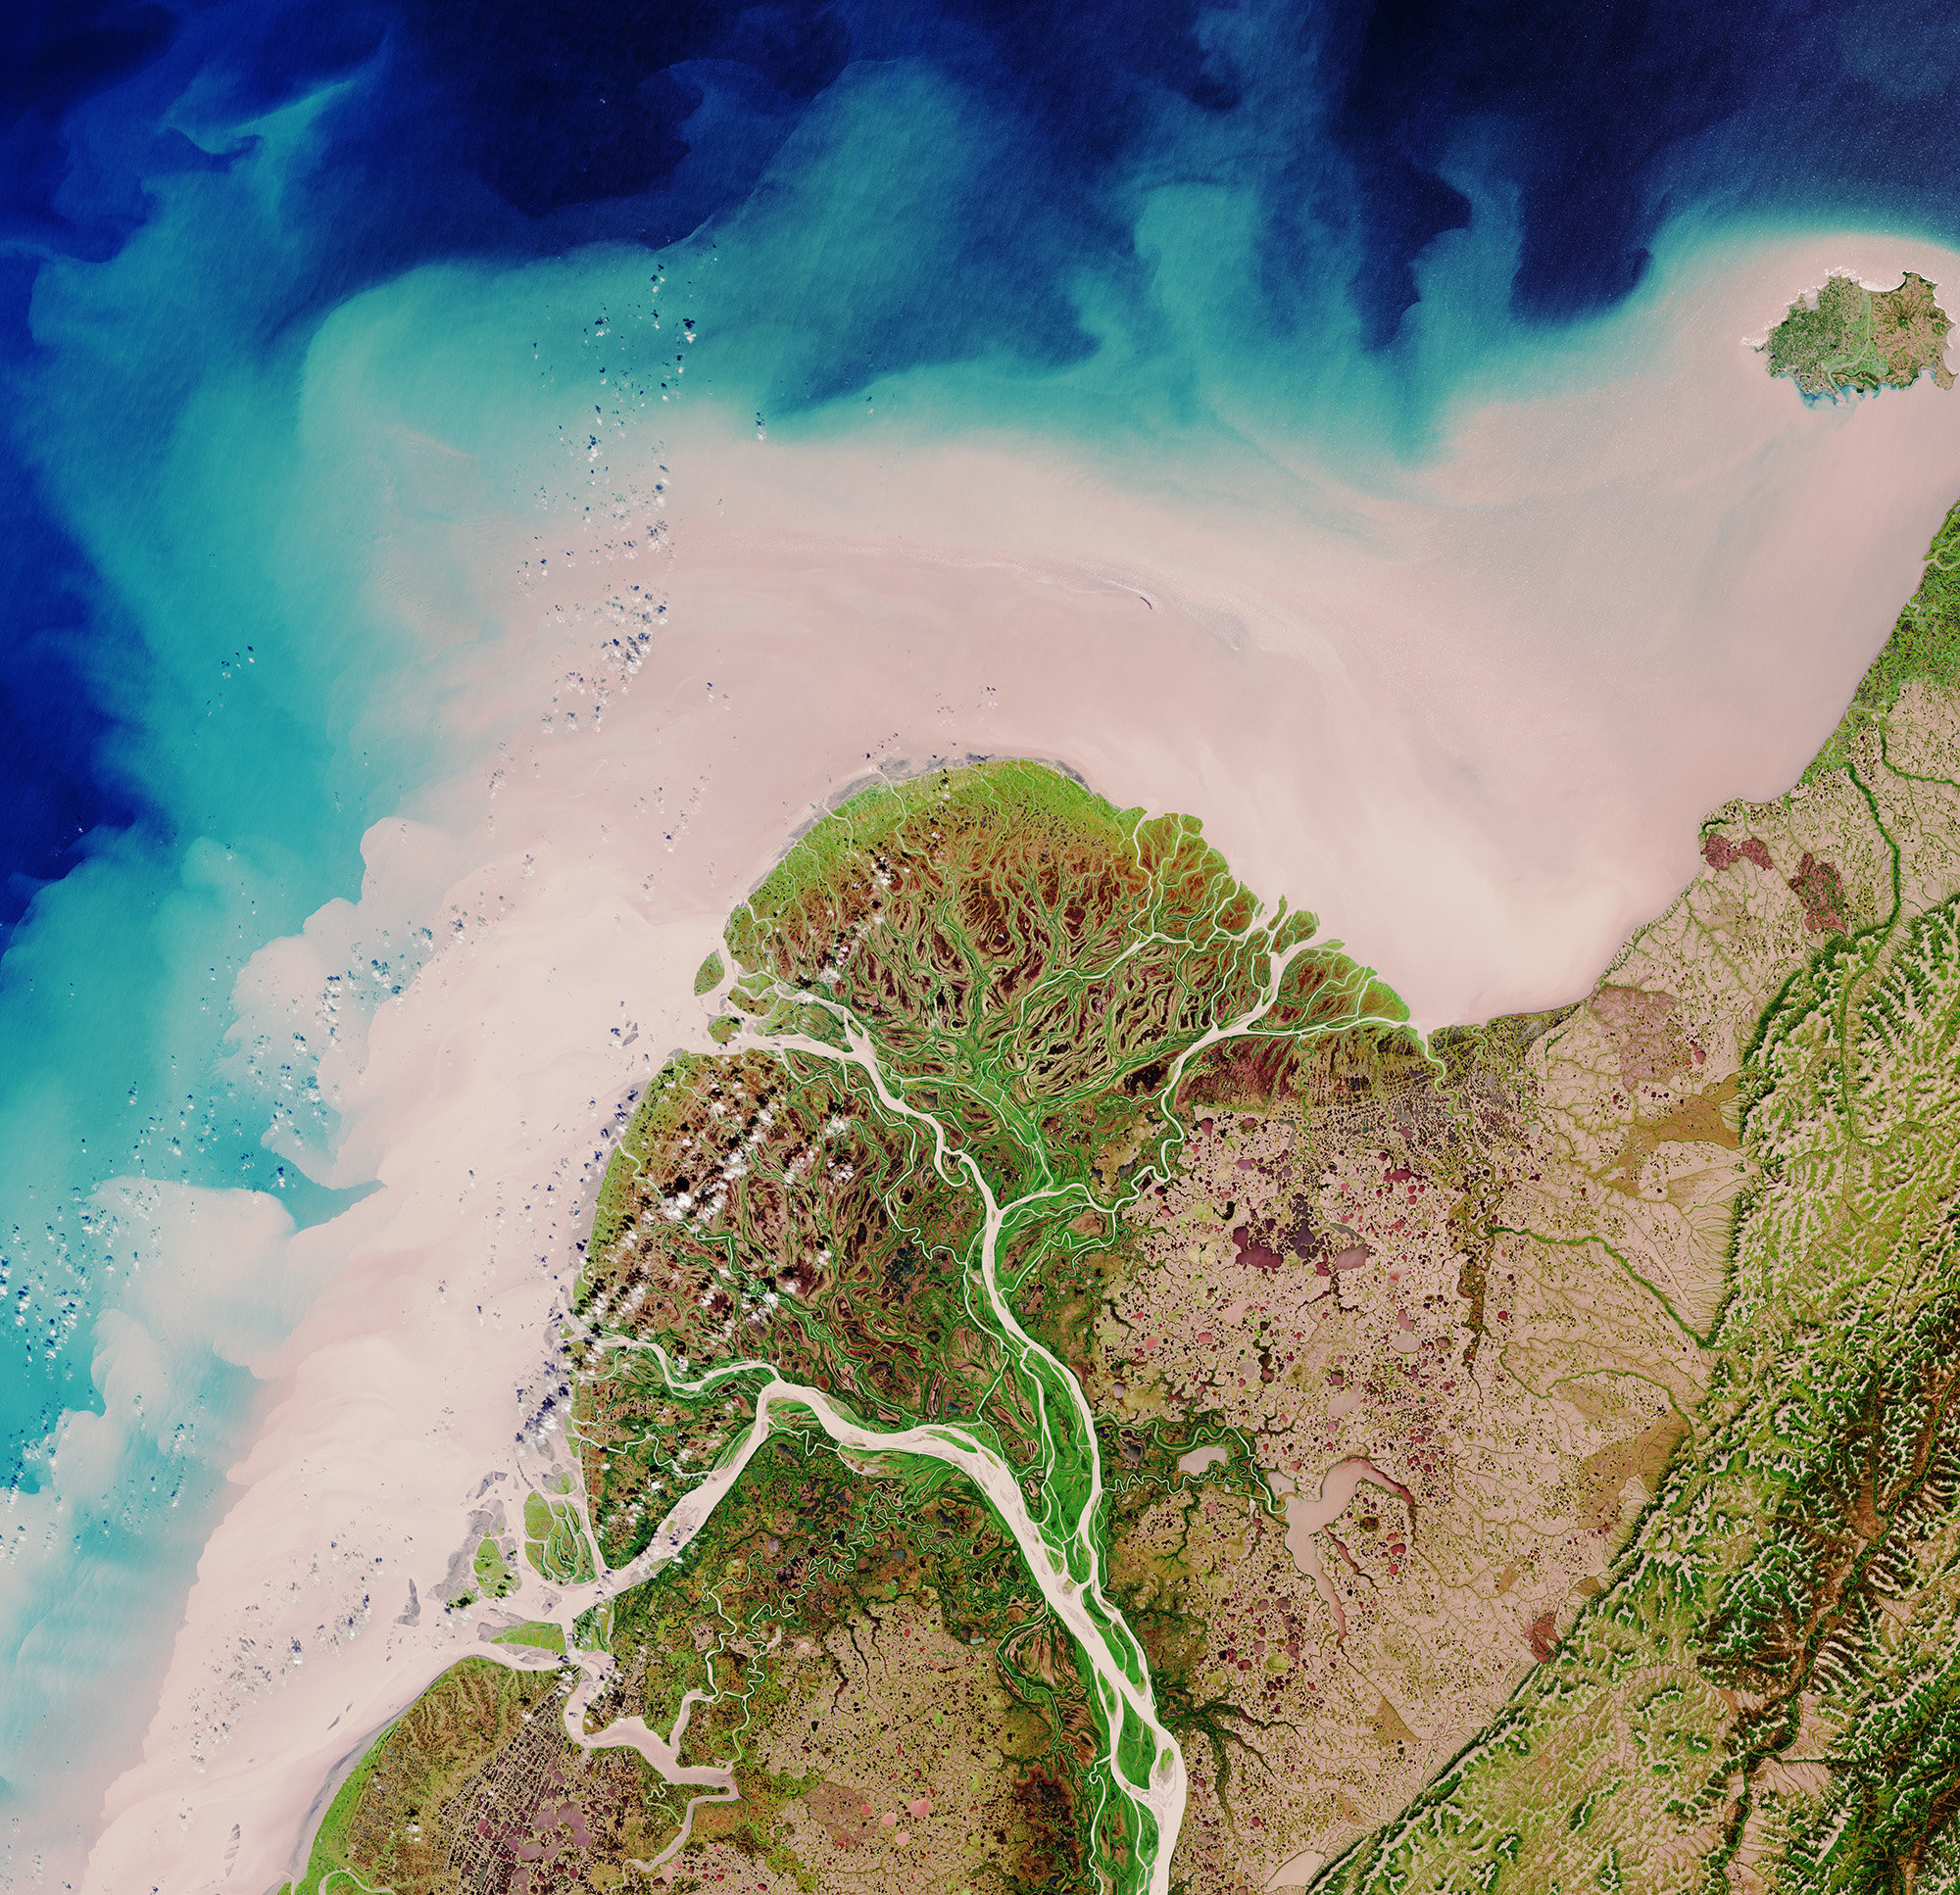
The above image shows the Yukon River Delta. Deltas (named by Herodotus for their somewhat triangular form reminiscent of the Greek delta character, ) are margins where rivers meet the sea (or another body of water) and deposit the last of the sediment load that they eroded and carried away from the highlands. The study of deltaic processes is a pretty neat niche within sedimentology, as they are deposited rapidly and short lived in geologic terms, and old deltas can have consequences for oil and gas exploration.
Here we see the main-drain of the Yukon territory and Arctic Northwest bifurcate into a complex network of meandering distributary channels. This delta has a classic lobate morphology and hummocky texture with a smooth shoreline. Here this means that there is an abundant supply of sediment being delivered enhancing the deltas construction. Simultaneously there are destructive process at work in the form of ice-shaped features and wave and tidal action. The construction/destruction relationship is how deltas are classified and compared. This system allows us to examine the relative contributions of changes in sea level, wave energy, tidal energy, sedimentation, flow intensity, seasonal melt, ice, etc. with time. The sea water near the terminus of the red and green sub-aerial parts of the delta is a light white/beige/gray in color because of sediment suspended in the water column that has not yet been deposited, usually because of small grain size. The primary mechanism of deposition for deltas is particles falling out of suspension in response to a reduction in flow velocity as the river becomes less confined.
Bigger Picture
That might be a bit pun-ish…
Data like this has been used to quantify changes in sediment transport and deposition rates. An increasing trend in sediment transport in the region has been interpreted to correlate with increased erosion associated with enhanced spring melt and thawing of permafrost - impacts of global climate change. This simple and beautiful image is one example of how remote sensing and satellite platforms continue to make significant measurements and draw impactful conclusions that would be impossible to measure with traditional field techniques.
I chose to write a little blurb about this photo because to me it showcases the importance of investing in scientific infrastructure. If the European Space Agency had not secured the funding to launch the massive Copernicus missions we would lack a comprehensive data set and some exceptional work would never have been possible. Many scientific satellites in orbit measure all sorts of fields and properties of Earths complex and dynamic systems, allowing us to have much greater spacial and temporal coverage of some very remote and hard to sample places. Coverage is a fundamental challenge for most of the Earth sciences, especially when it comes to understanding vast remote high latitude regions and the expansive depths of the oceans.
A fundamental misunderstanding is that these very expensive and highly precise instruments are just taking pictures, but they do much more than that. For instance, the Sentinel-2 pair of satellites measure in 13 frequency bands spanning the visible and infrared parts of the EM spectrum. The main purpose of this mission is monitoring land use and vegetation changes, but obviously the data, which happens to be free and open, can be utilized by creative scientists to solve a much more expansive set of problems, as this image demonstrates.
Observations lay the foundation for improving our understanding of our environment, and it’s imperative that we continue to invest in basic research and observational infrastructure. In addition to the above Yukon photo, I have recently read two other articles and listened to a podcast all touching on this topic and inspiring me. One was another satellite story, and a very cool one at that, using open data to explore the coverage of current operational missile detection satellites. The other points out that a pretty small initial investment in an integrated whole-Earth monitoring network could provide substantial scientific and societal benefits. Planet Money did a series of episodes on launching their own cubesat. The entrirety of our present knowledge of natural laws and modern technological advancement is rooted in the findings of generations of inquisitive minds who actively observed the world around them. Now is the time to give back to ourselves and the international scientific community by rejuvenating public interest in funding basic research infrastructure and highlighting the services and concrete outcomes we all benefit from.
EDIT 1/31/18 - Satellites are becoming an oddly common theme, here is another interesting post I just read about a guy who looks for satellites, and just found a lost NASA probe called IMAGE. Pretty Neat.